The problem
A new driver succeeds on 30% of trips, vs 50% for an experienced one. First trip fails, they never publish again.
What the data showed
Successful trips: the starting gap
30%
New drivers
50%
Experienced drivers
Successful-trip gain when a new driver has…Across 100,000 trips. In grey: no gain. Correlations later confirmed in interviews.
Verified ID
Trip description
Profile photo
Auto-accept
What I did
Data100,000 trips analysed. New drivers lack the trust signals (ID, photo, description).
Research10 interviews. Photo and ID don’t make passengers choose; they break ties at equal times.
Prioritisation10 problems, 3 features kept, ranked by impact and effort. Dropped: auto-accept (no gain in the data) and post-trip feedback (it targets the 2nd trip). Target: +10 pts in 12 months.
PrototypeFigma mock-up tested with 4 people, 3 changes, then a web app I coded alone with Claude Code.
Delivery4-month roadmap, quick win first. The boost waits until month 4 because it stacks risks (passenger trust, experienced drivers penalised): A/B test with passenger rating as guardrail.
The prototype
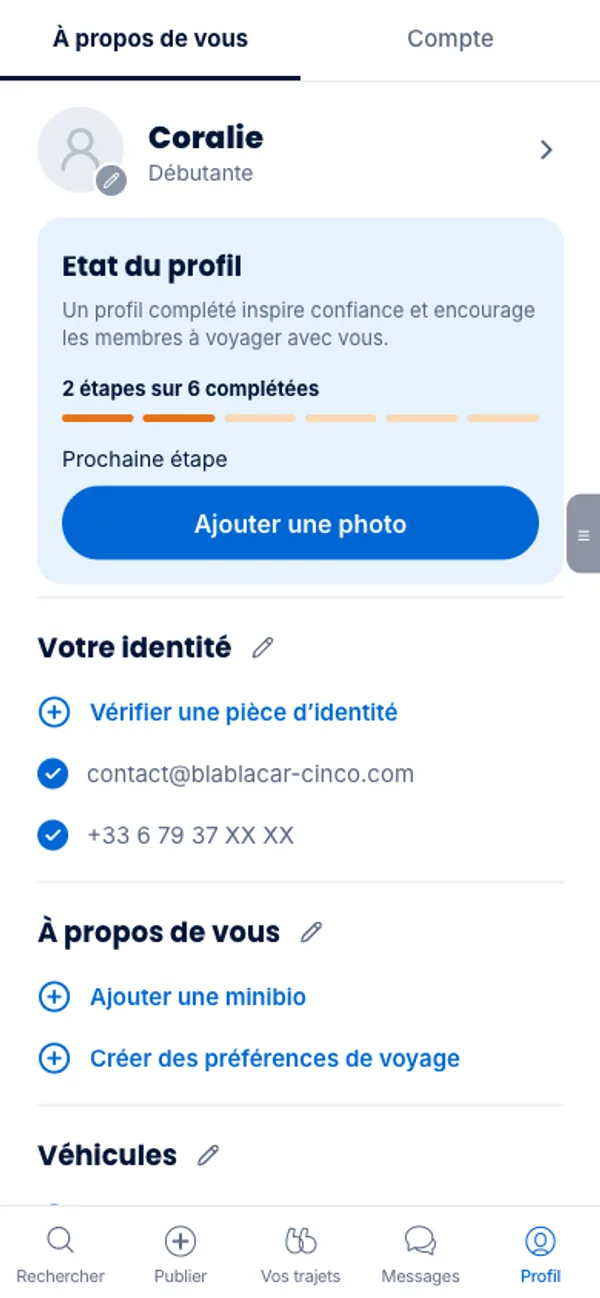
A training prototype, not an official BlaBlaCar app (in French). Driver and passenger flows start from the demo menu.
Open the prototypeThe team’s Figma mock-upAt a glance
40%successful-trip target in 12 months (30% today)
~6points of successful trips identified in the data, out of the 10 targeted
3changes after testing
What I took away
“Data gives you the what, research gives you the why.”How I work →